Gold/Silver Ratio as a Leading Indicator of Stock Markets in General: Is a Crash on the Way?
 |
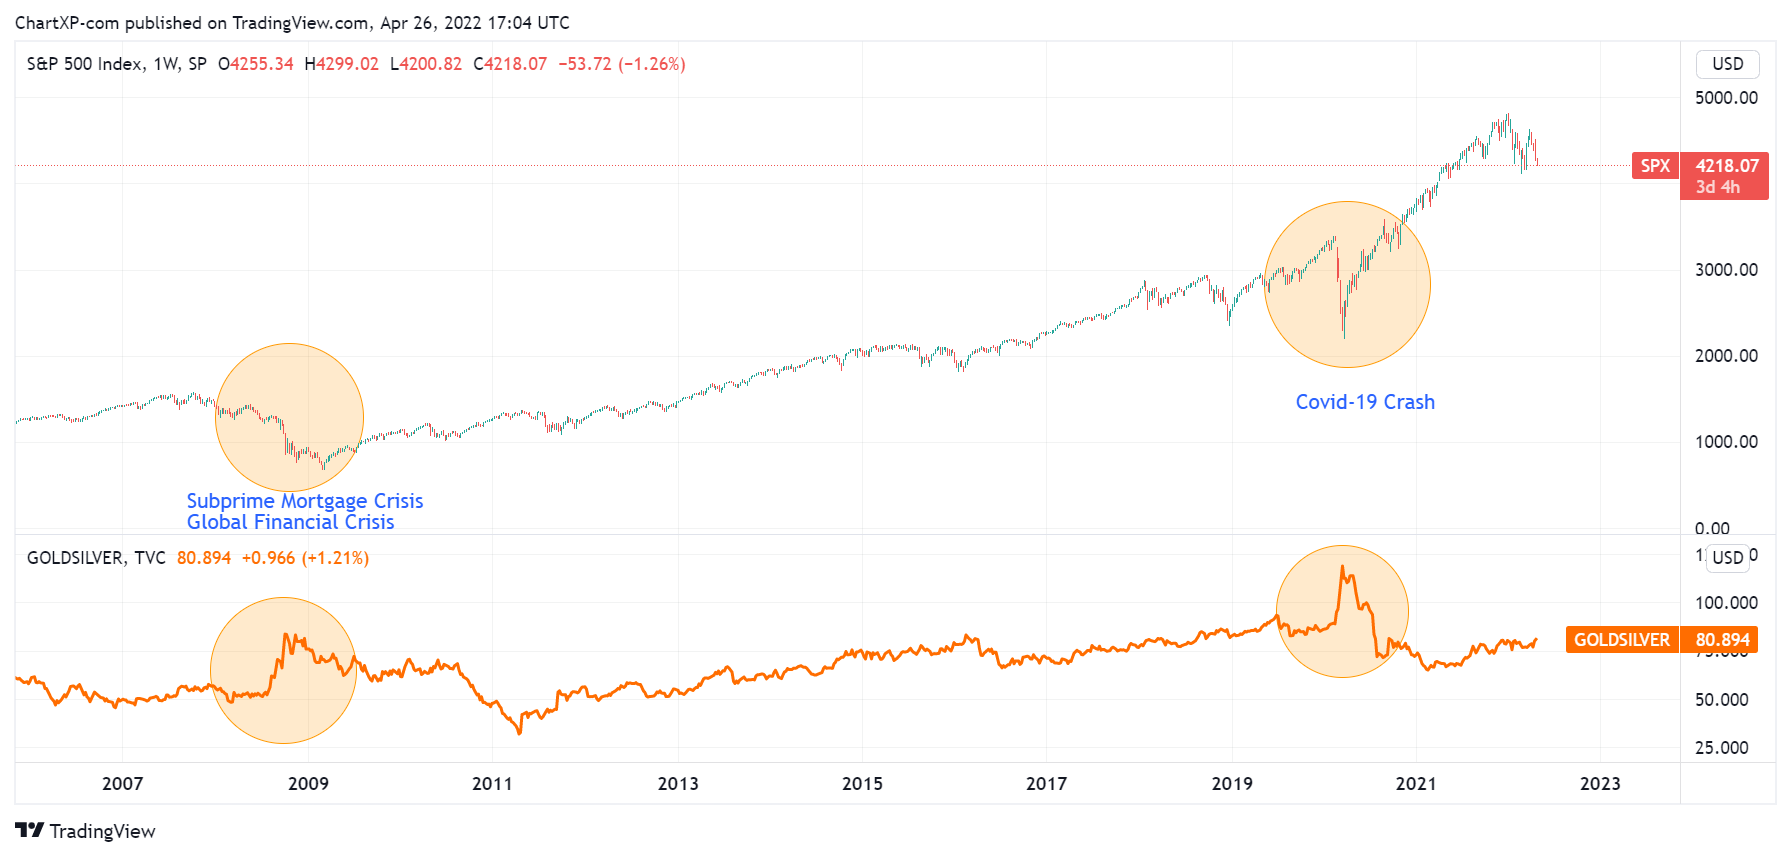
| Gold/Silver Ratio and SPX Weekly Charts April 26, 2022 |
Every time the gold/silver ratio spikes, we see stock markets crash. We can see this in the sub-prime mortgage crisis/the global financial crisis and the COVID-19 crash.
 |
| Gold/Silver Ratio and SPX Daily Charts April 26, 2022 |
On the daily chart, we can see that, currently, the gold/silver ratio forms a triangle pattern that is ready to spike. The S&P 500 (SPX) as a equity market benchmark itself is in a poor shape.

Post a Comment for "Gold/Silver Ratio as a Leading Indicator of Stock Markets in General: Is a Crash on the Way?"